A common trap in financial planning is hoarding cash for catastrophic events like major medical emergencies, car crashes, or lawsuits, when those risks are more efficiently transferred to insurance. A true liquidity fund serves a much simpler purpose: it provides a buffer for temporary income gaps, offers behavioral stability during market declines, and ensures you never have to sell long-term investments at a loss to cover expenses. This tool can help you better navigate these tradeoffs to arrive at a liquidity fund that matches your needs.
Features
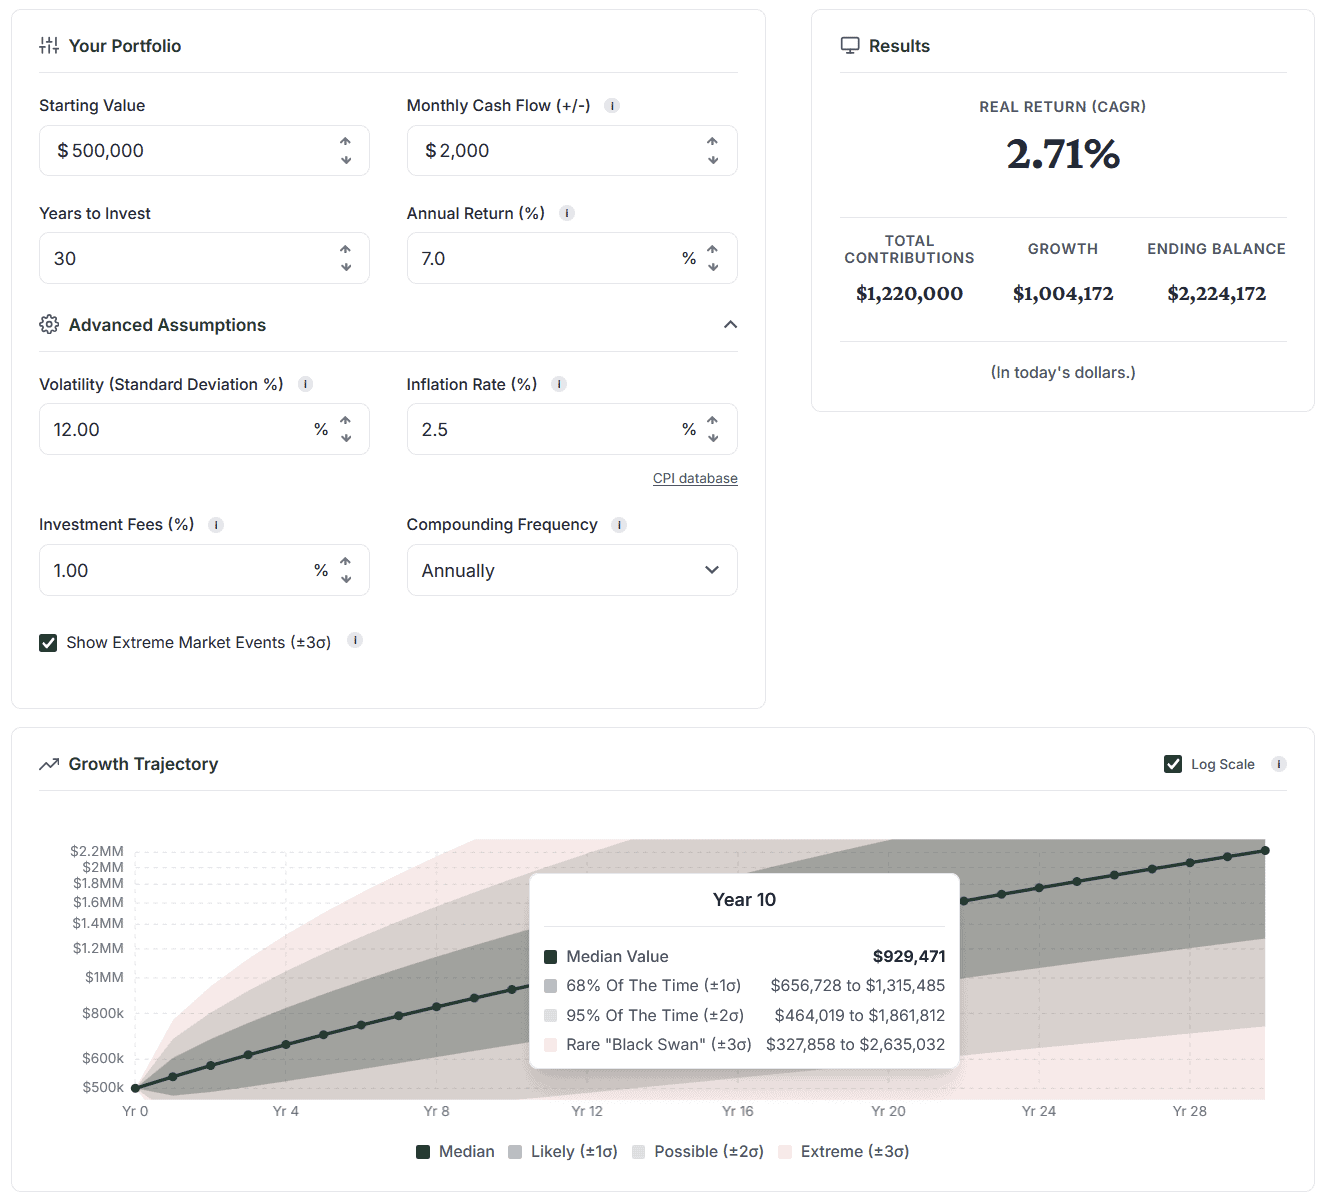
- A Clear Finish Line: Use the sliders to choose how much extra cash you want to save each month, and the tool will show you the exact month and year your liquidity fund will be completely full.
- Smart Targets: Toggle whether you have dependents or high-interest debt, and the tool will instantly adjust your recommended cash target based on your situation.
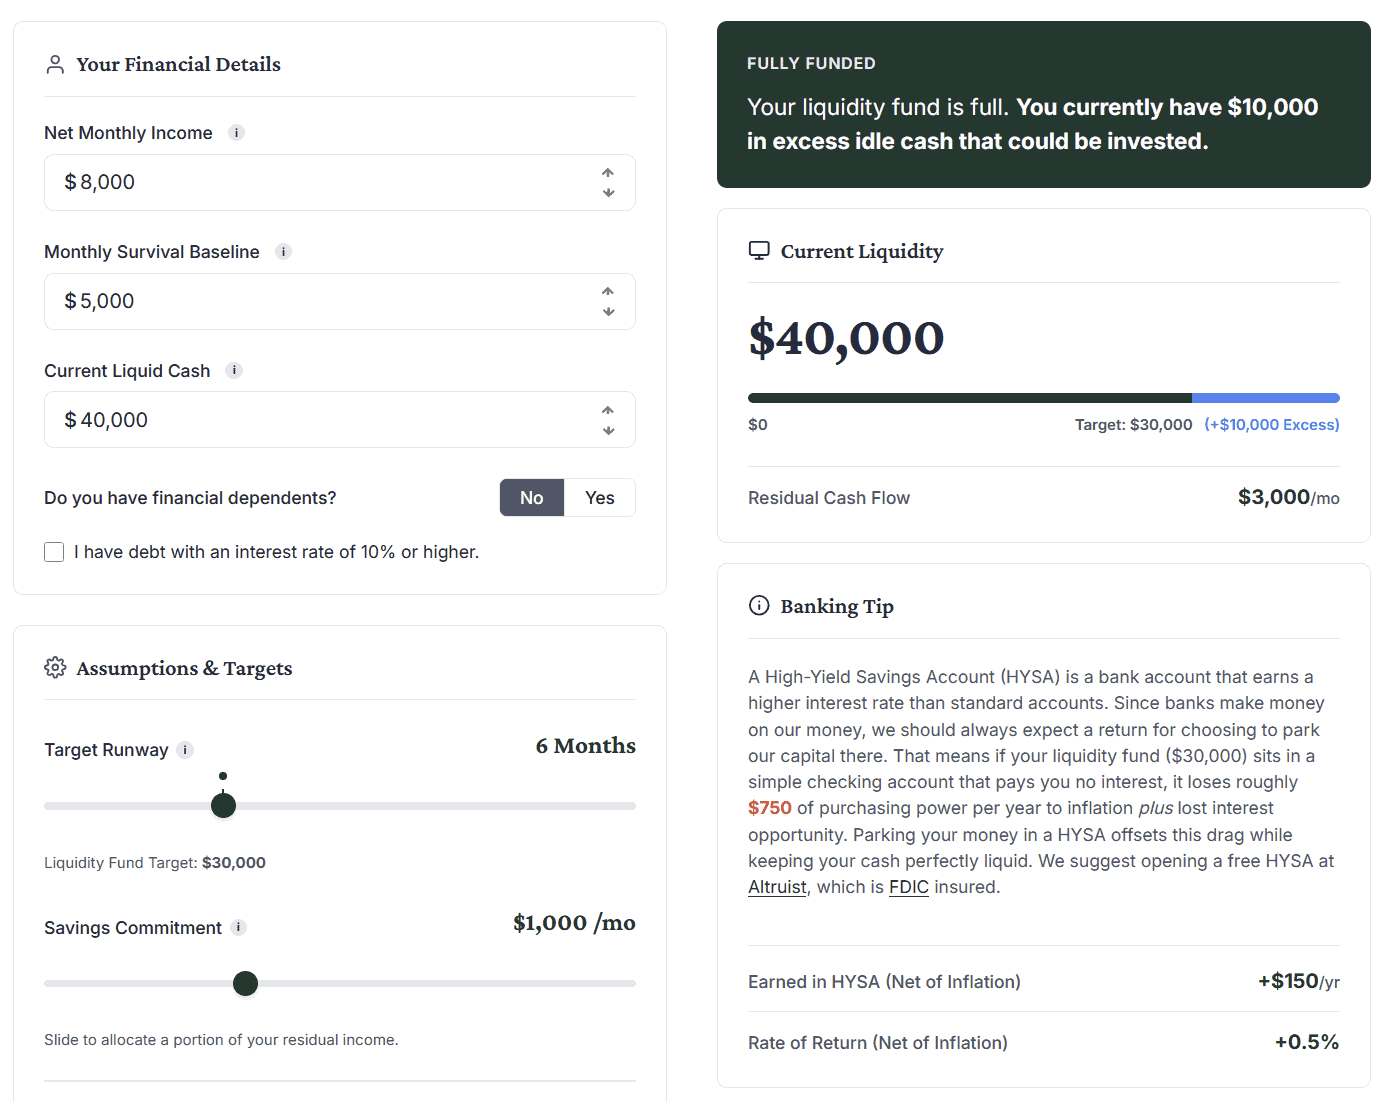
- Checking vs. Savings: See exactly how much buying power your cash loses to inflation in a regular checking account versus how much you can earn back by switching to a high-yield savings account.
- Spotting Excess Cash: Look at the dynamic progress bar to visually spot if you are holding too much cash, showing you the exact dollar amount that could be moved out of idle cash and invested for your future.